For those who’ve been around from the early Hubbl Diagnostics days, you may have noticed some changes. In fact, the platform is barely recognizable from what it looked like just six months ago.
From re-brand, to product facelift, and new features there’s a lot to catch you up on!
TIP: For those who ran a scan before July 2022 and haven’t looked at the results since, you may want to jump back in and check out the new data, dashboards, and visualizations available on your existing scans.
Unless you’ve been living under a rock, you’ve likely heard about the upcoming retirement of Workflow Rules and Process Builder. For most Salesforce administrators, who’ve relied on declarative automation for years, it will come as no surprise that the migration effort to Flow will be considerable. But do you know exactly what that looks like for your org?
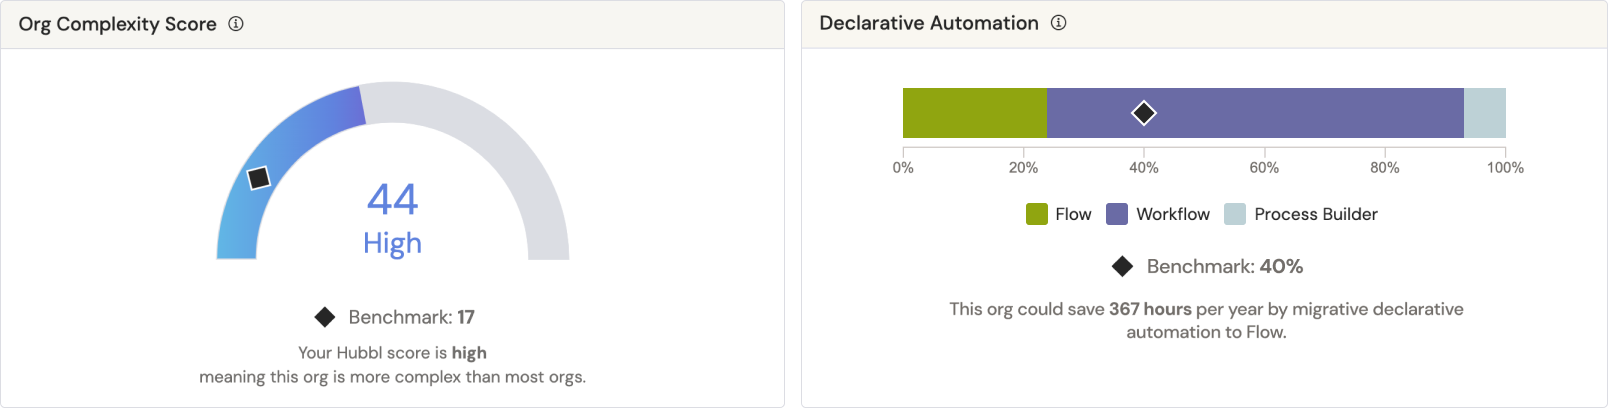
We recently dug into the data in our Hubbl Diagnostics Benchmark Report, and what we found was surprising. Based on analysis of our aggregate data, the average Salesforce org has:
To help, we’ve developed a Declarative Automation snapshot that highlights the percentage of active declarative automation that needs to be migrated to Flow before the retirement of Workflow Rules and Process Builder.
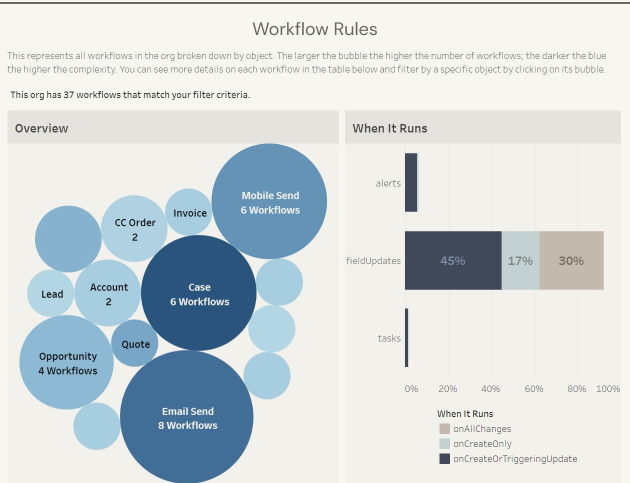
We’ve also created three new results tabs (Workflows, Processes, and Flows) to help you visualize, prioritize, and monitor the migration to flow. Each of these three new tabs are similar and allow you to identify complexity at a glance. Let’s look at Workflows as an example, but feel free to login to your Hubbl Diagnostics account to check out the new results tabs yourself!
The Workflows tab provides a full view into all your workflows with their respective rules and actions grouped by object. The visualization on the top left provides a view of all objects with workflows. Each bubble is sized and colored by workflow complexity—the larger the bubble the more workflows, the darker the blue the higher complexity.
The visualization on the left displays the percent of workflow complexity broken out by trigger types and actions. This enables you to easily identify where the bulk of your workflow complexity resides. Clicking on one of the object bubbles will change this visualization allowing you to drill down into more details.
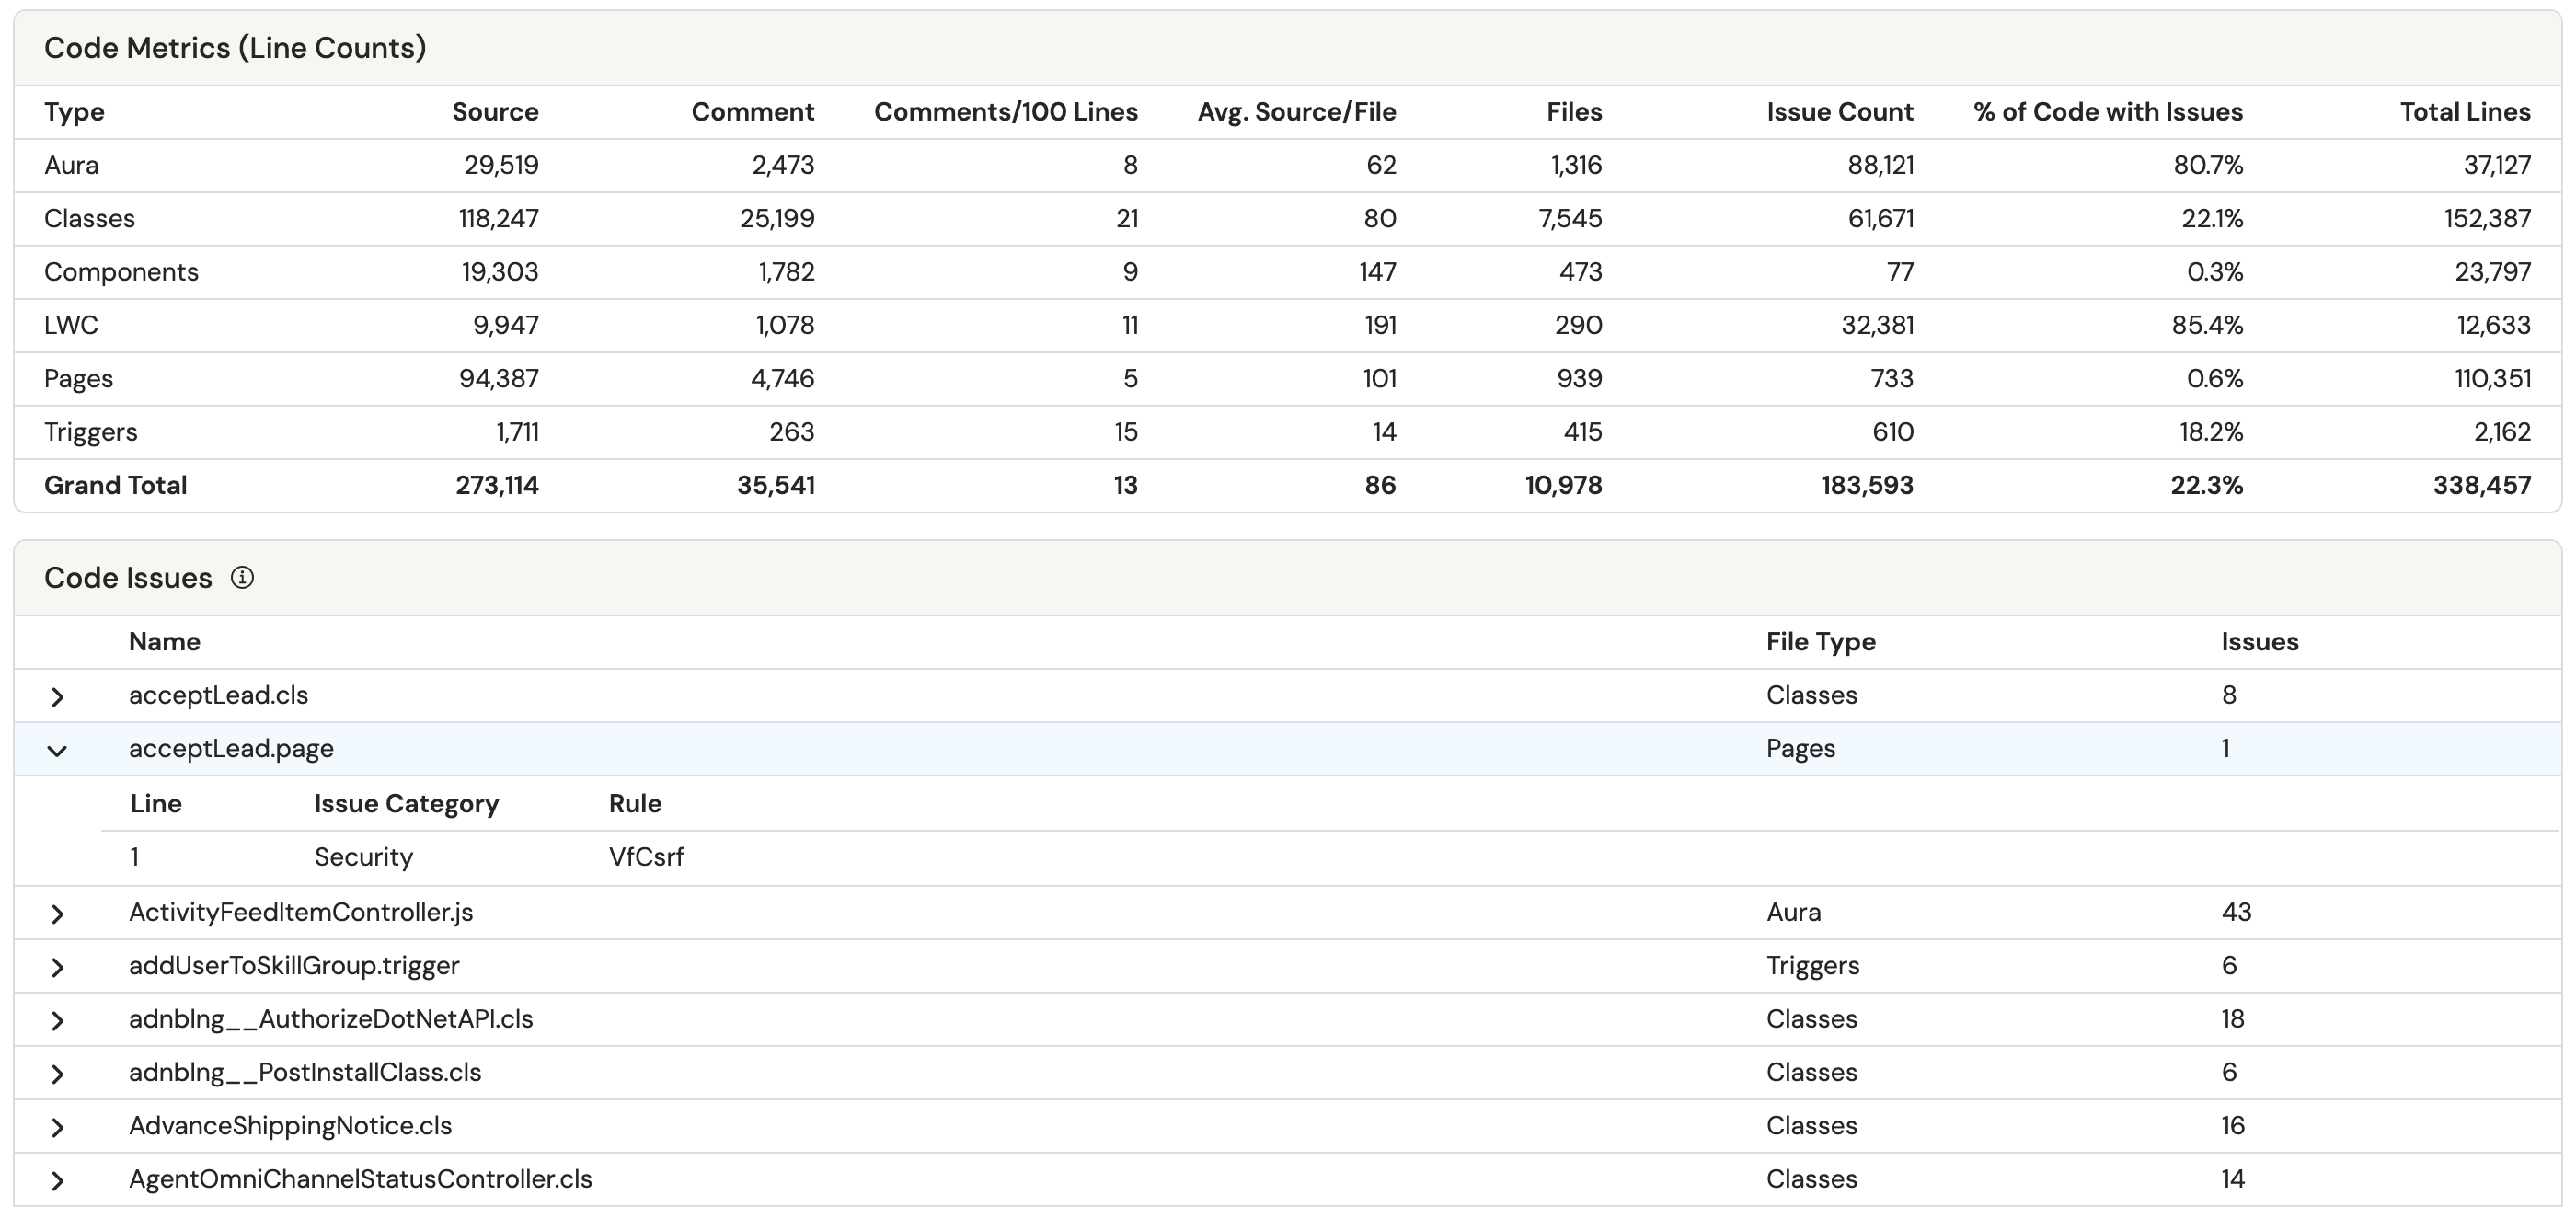
Custom code giving you grief? We’ve added a brand new results feature to the Hubbl Diagnostics platform to help identify and prioritize custom code issues.
The Custom Code tab shows a wide range of metrics related to the Apex and Javascript within your org. This will enable you to not only see the volume of custom code, but identify specific issues found within the code itself.
In the donut chart, you can see the percent breakdown of the types of issues you have, such as lack of documentation, potential for errors, performance issues, code style and design, and how much the code adheres to best practices.
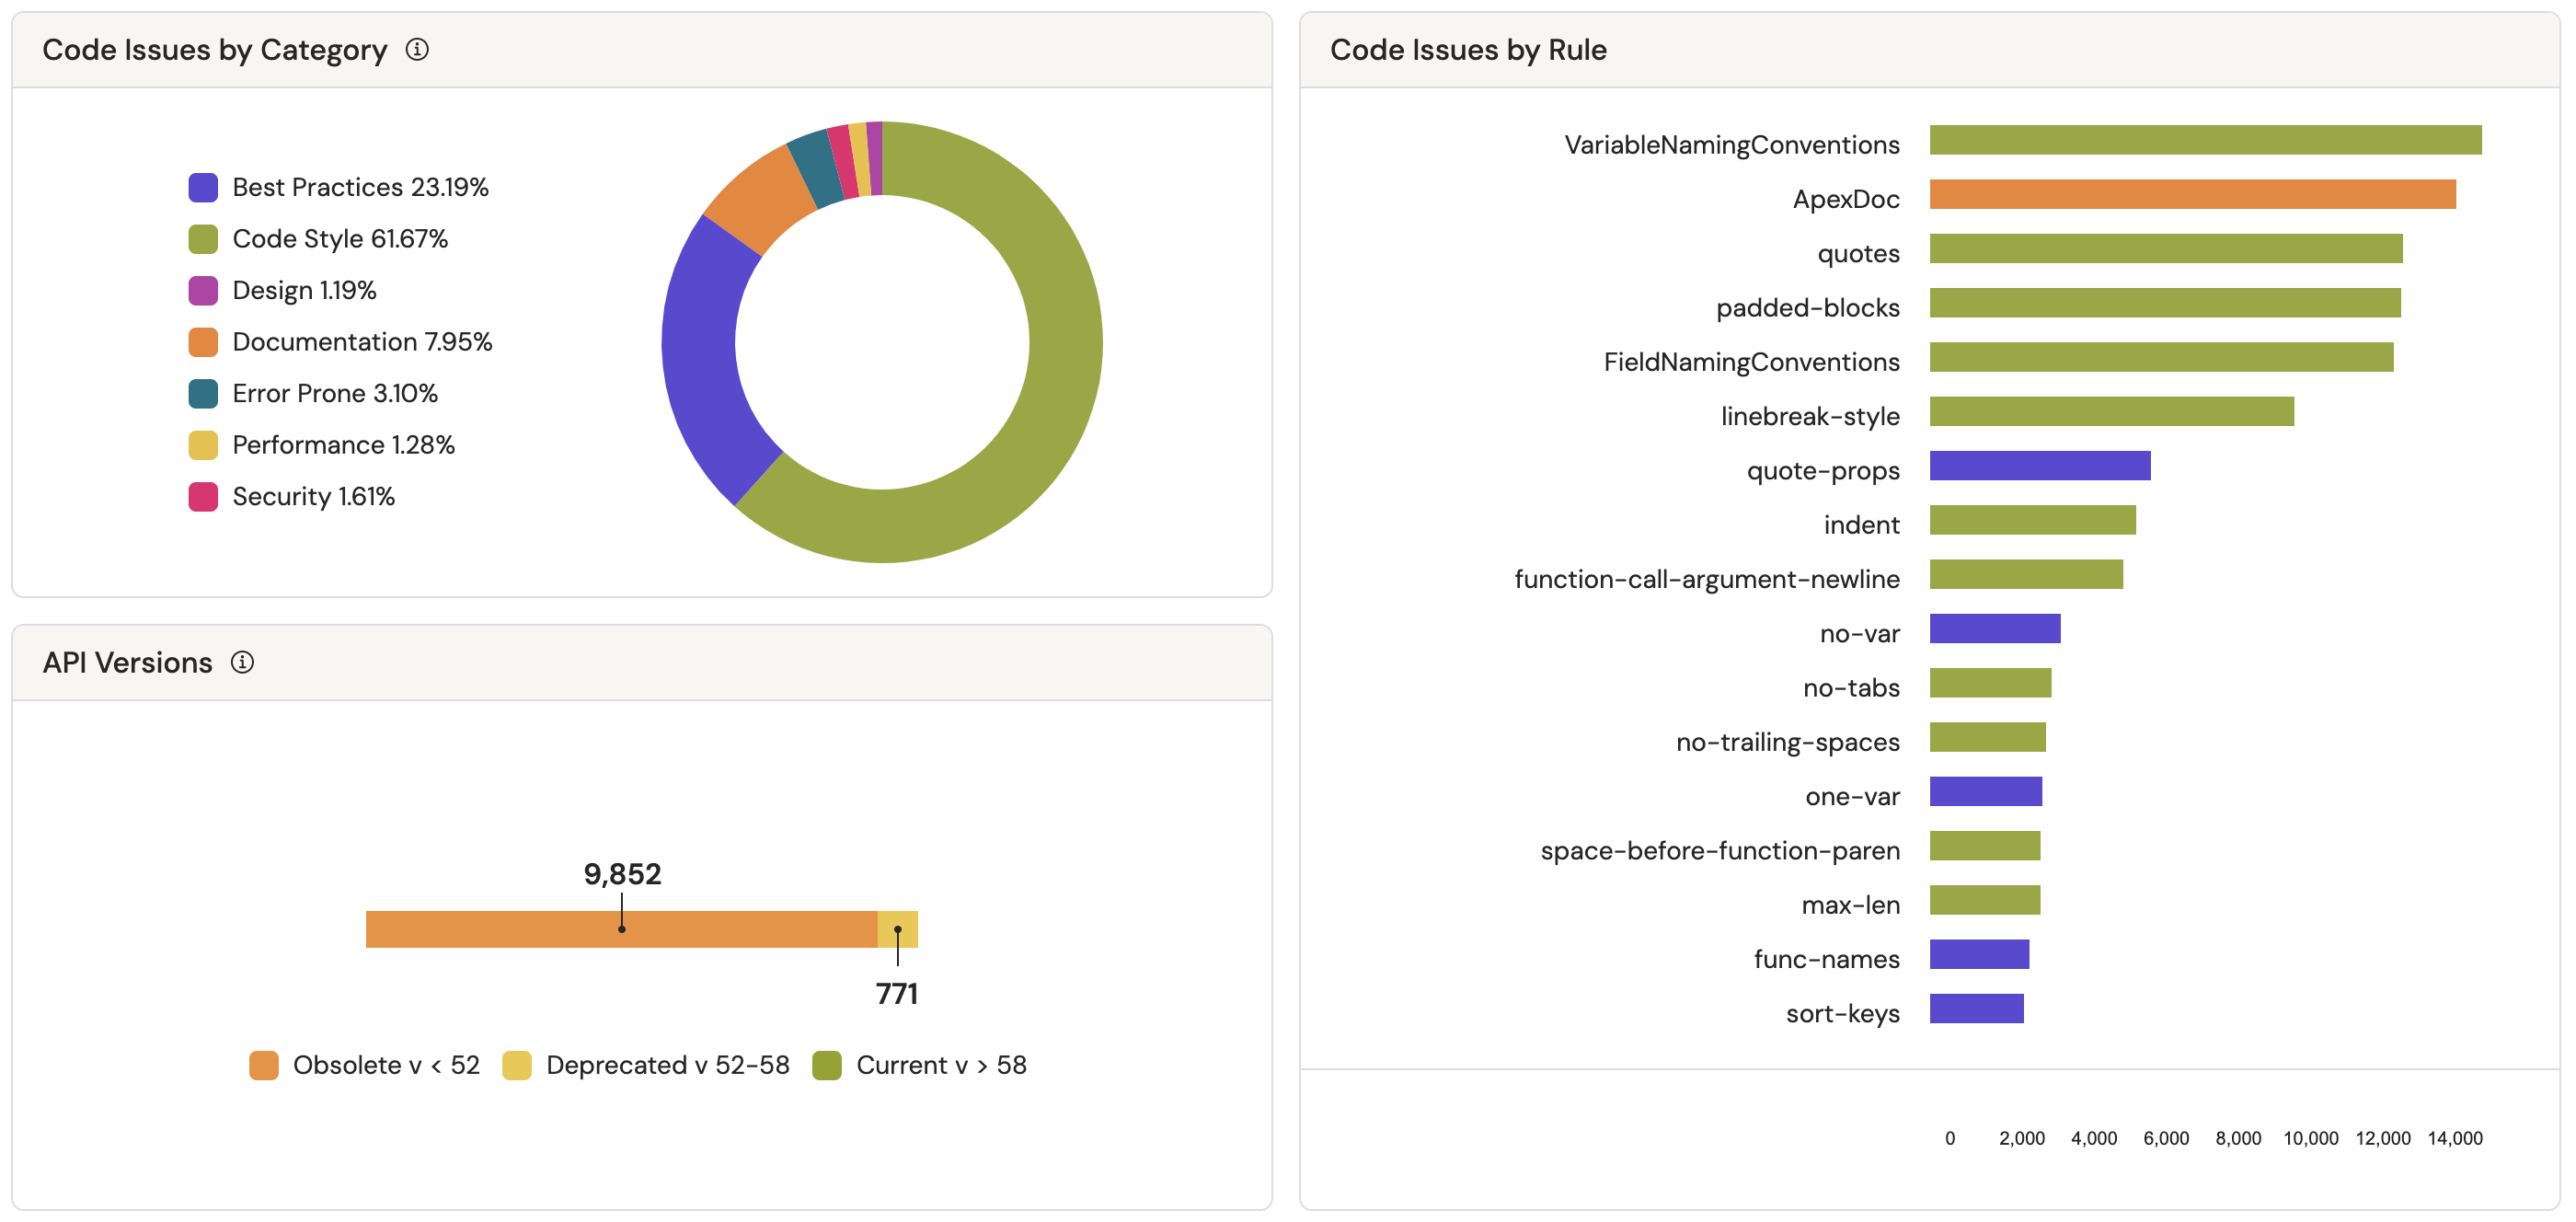
Below that, you’ll find the Code Metrics Table and Code Issues Table that breaks out the orgs code by type including Aura components, Apex classes and triggers, and Lightning Web Components (LWC), and displays a variety of useful aggregate metrics. From there, you can explore all your code issues and relevant details in a single view.
Identifying problematic Salesforce code has never been easier!
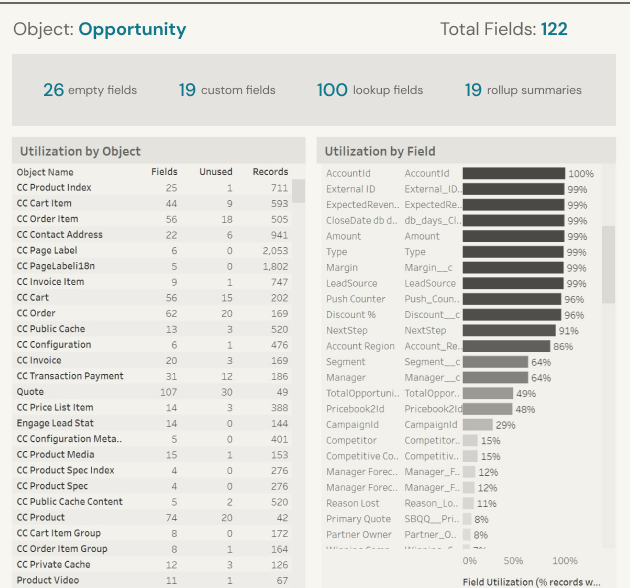
We’ve also added the Field Utilization dashboard which allows you to assess the utilization of fields on each object in your org.
Empty fields and custom fields are the main focus on this dashboard, especially when they co-occur. An empty custom field is technical debt where someone built a custom piece of functionality that is not used.
Choose any object to review by using the filters or selecting it from the Utilization by Object table on the left (we chose Opportunity in the example below). Using the Utilization by Field table on the right, we can identify how often each field is used. Any field with a low utilization indicates an infrequently used or unused field and should maybe be removed to make your org easier to use and maintain.
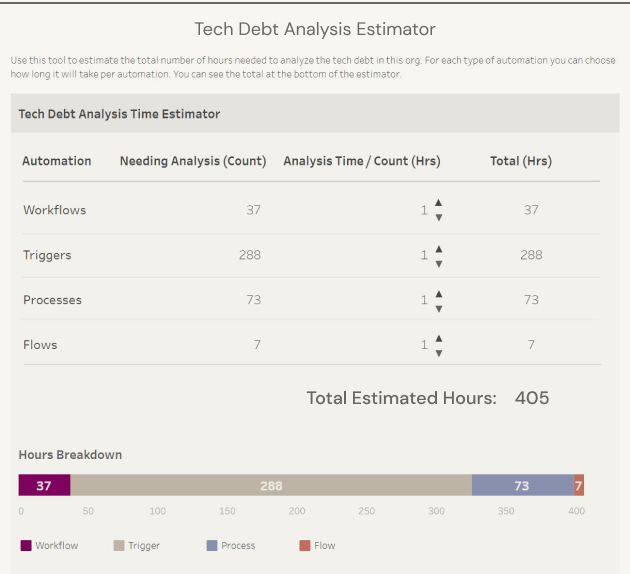
Estimating technical debt remediation effort just got a whole lot simpler. In our latest release, we’ve updated the results page to include a new and improved Technical Debt Analysis Estimator.
For each type of automation, you can choose the number of hours that you estimate it will take to analyze and plan remediation efforts. The calculator automatically assumes one hour for each process, flow, trigger, and workflow, but can be easily adjusted. You’ll see a breakdown of the total hours by type of automation at the bottom. The results can be exported to a Google Sheet or CSV to be used with any additional estimation tools.
Completed your scan before the new features rolled out? No worries! Just log back into your scan and click through the tabs to see all the new data, visualizations, and results.