The Summary dashboard offers a comprehensive overview and trends analysis of the scanned org, providing valuable insights into complexity, migration potential, object usage, recommendations, benchmarking, trending data, and more. The Summary dashboard is broken into two views, Overview and Trends. Find these views on the right side of the dashboard.
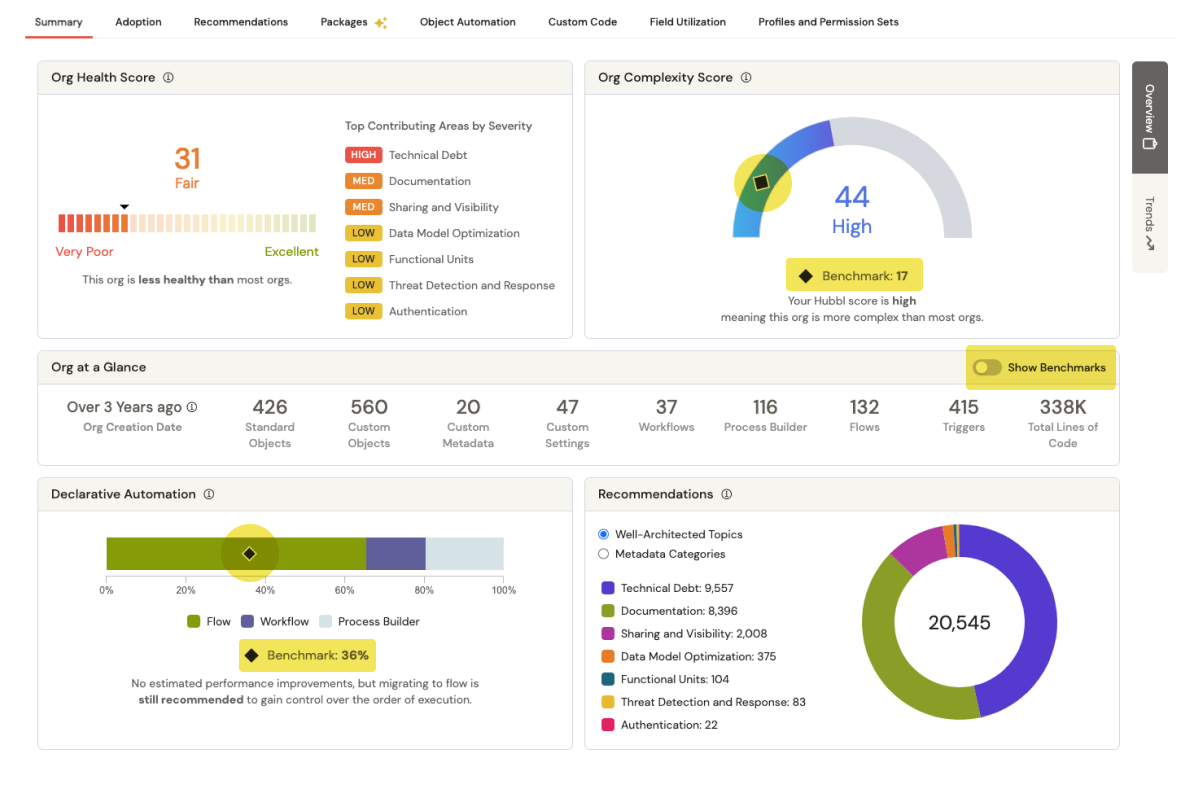
OverviewThe Overview provides a summary of your org scan results. Let’s dive into the key metrics:
1. Org Health Score: A comprehensive evaluation of your org's health, including a score, a grade, and a detailed breakdown. The Org Health Score is calculated based on industry-leading practices, integrating our proprietary insights with the Well Architected Framework and Salesforce Health Check Score.
2. Org Complexity Score: A numerical score ranging from 0 to 100 that helps you evaluate the complexity of the scanned org. Higher scores indicate greater complexity.

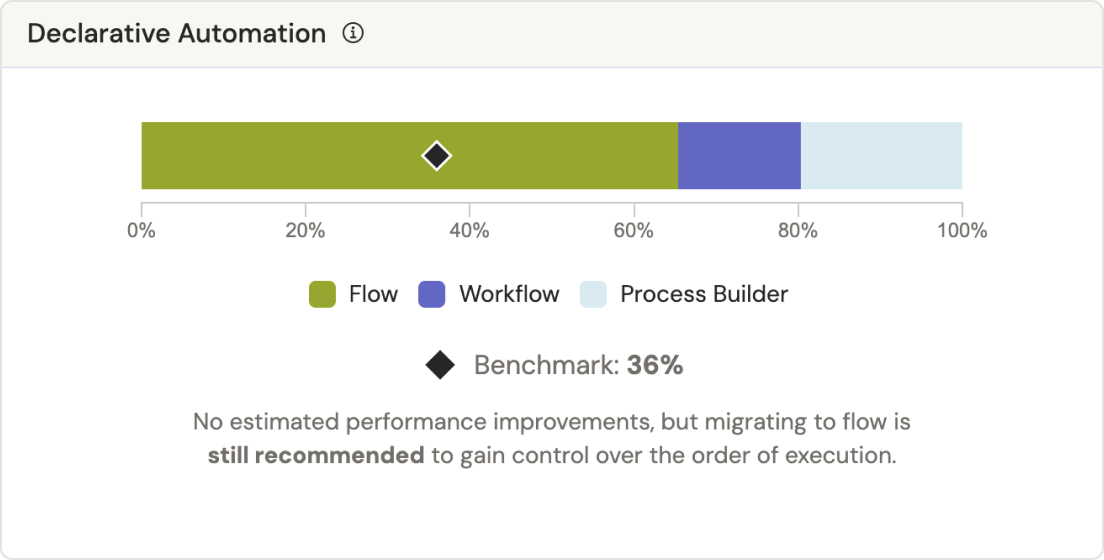
3. Migration to Flow: Estimate potential time savings by migrating Process Builder and Workflows to Flow, leveraging record volumes and performance data.
4. Org at a Glance: A quick summary of various org-related information, providing a snapshot view for easy reference.
5. Recommendations: Breaks down detected recommendations by category, aligned with Salesforce Well-Architected Topics and Metadata Categories.
6. Benchmarking: Benchmark stats are generally indicated with a black diamond. Toggle to view benchmark results in the “Org at a Glance” section, comparing scan results against ecosystem averages for key metrics on the Summary dashboard. Benchmarking helps provide insights into your Salesforce org’s performance relative to industry standards.
Navigate to the Trends view, on the right-side panel, for org trends analysis over multiple scans. The Trends view provides a series of metrics to help visualize your org over time. Choose between 30-days, 3-months, and 12-months to track.
Let’s take a look at the metrics displayed on the Trends view:
1. Org Health Score: Is your org health improving or declining over time?
2. Org Complexity Score: How does your org complexity evolve? Note: More complexity isn’t always a bad thing, but it’s important to understand why complexity is changing over time.
3. Migration to Flow: How are you progressing with your migration to Salesforce Flow?
4. Record Count by Cloud: Compare the number of records associated to each cloud over time.
5. Count of Packages: Track the number of installed packages in your org over time.
6. Issue Count per Category: Track the number of issues in your org over time. These can be sorted by Well-Architected Topics or Metadata Categories.

🚀 Hubbl Tip: Utilize the Date Range filter for focused trend analysis, and expand charts for detailed insights in advanced scans.