The Recommendations dashboard is a powerful tool designed to pinpoint issues within a Salesforce org and provide actionable recommendations for improvement. By leveraging this dashboard, users can enhance org performance, address potential issues, and align with industry best practices.
The Recommendations dashboard draws from the metadata across your org to extract your top risks, opportunities, and areas for optimization. Sorted by either Well-Architected Topics or Metadata Categories, you’ll find the top issues in your org along with recommendations to fix them.
🚀 Hubbl Tip: Export recommendation results to CSV and import them into your preferred work management tool for streamlined action and collaboration.
The Recommendations dashboard is broken into three views, Overview, Details, and Trends. Find these views on the right side of the dashboard.
The Overview provides a summary of your top recommendations. Filters can be applied using the dropdowns. Metrics can be sorted by either Well-Architected Topics or Metadata Categories. Let’s dive into the key metrics:
1. Issues by category: View the number of the issues in your org. These can be sorted by Well-Architected Topics or Metadata Categories using the buttons above. Select a segment to drill down into recommendations by category.
2. Namespaced vs. non-namespaced issues: Explore the number of namespaced vs non namespaced issues in your org. Metadata with a namespace is part of a managed package, or optionally an unlocked package.
3. Issues severity vs. effort: What recommendations should you prioritize? Review your top recommendations for optimization, sorted by severity and effort.
4. Recommendations: View your optimization recommendations.
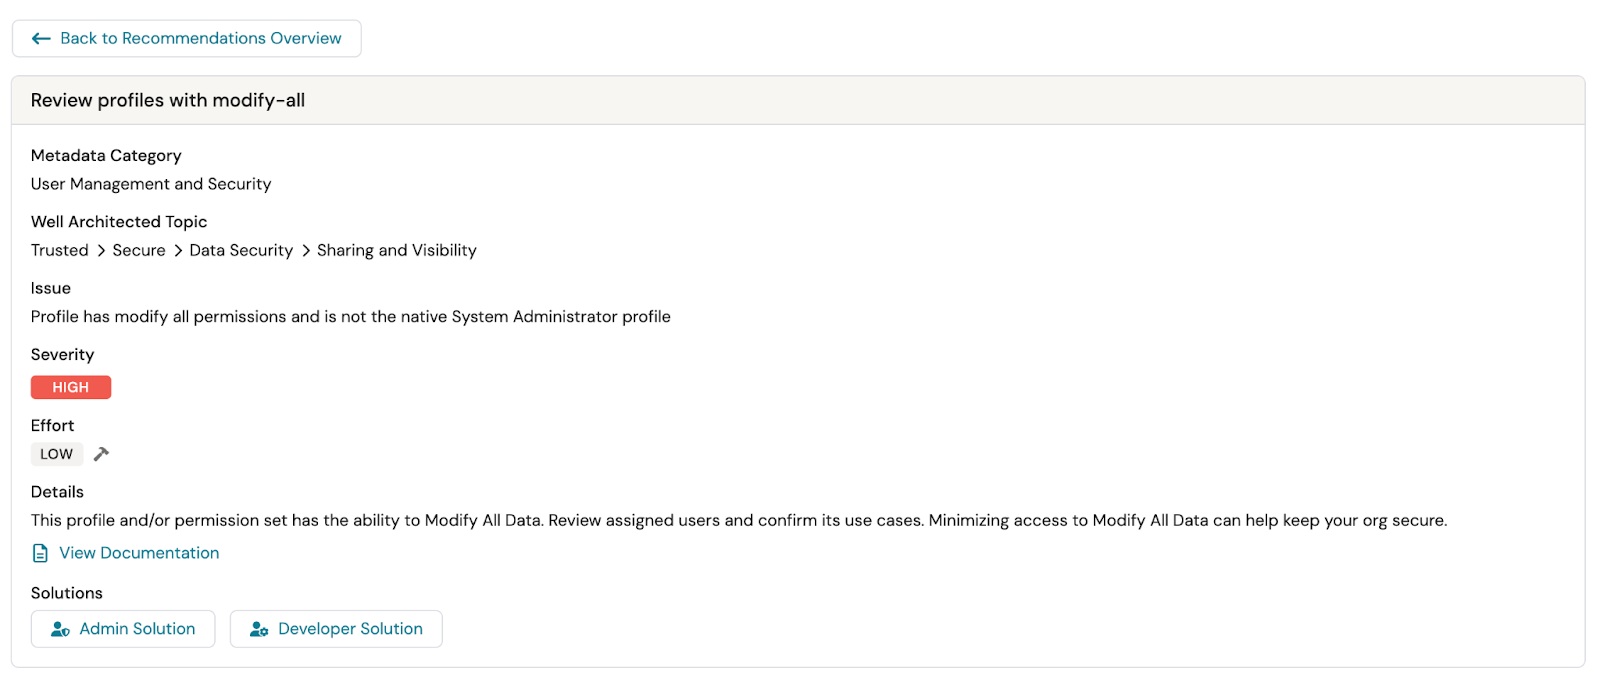
The Details view lets you drill down into each recommendation and its solution.
1. Select Recommendation: Select a recommendation from the Recommendations Details table.
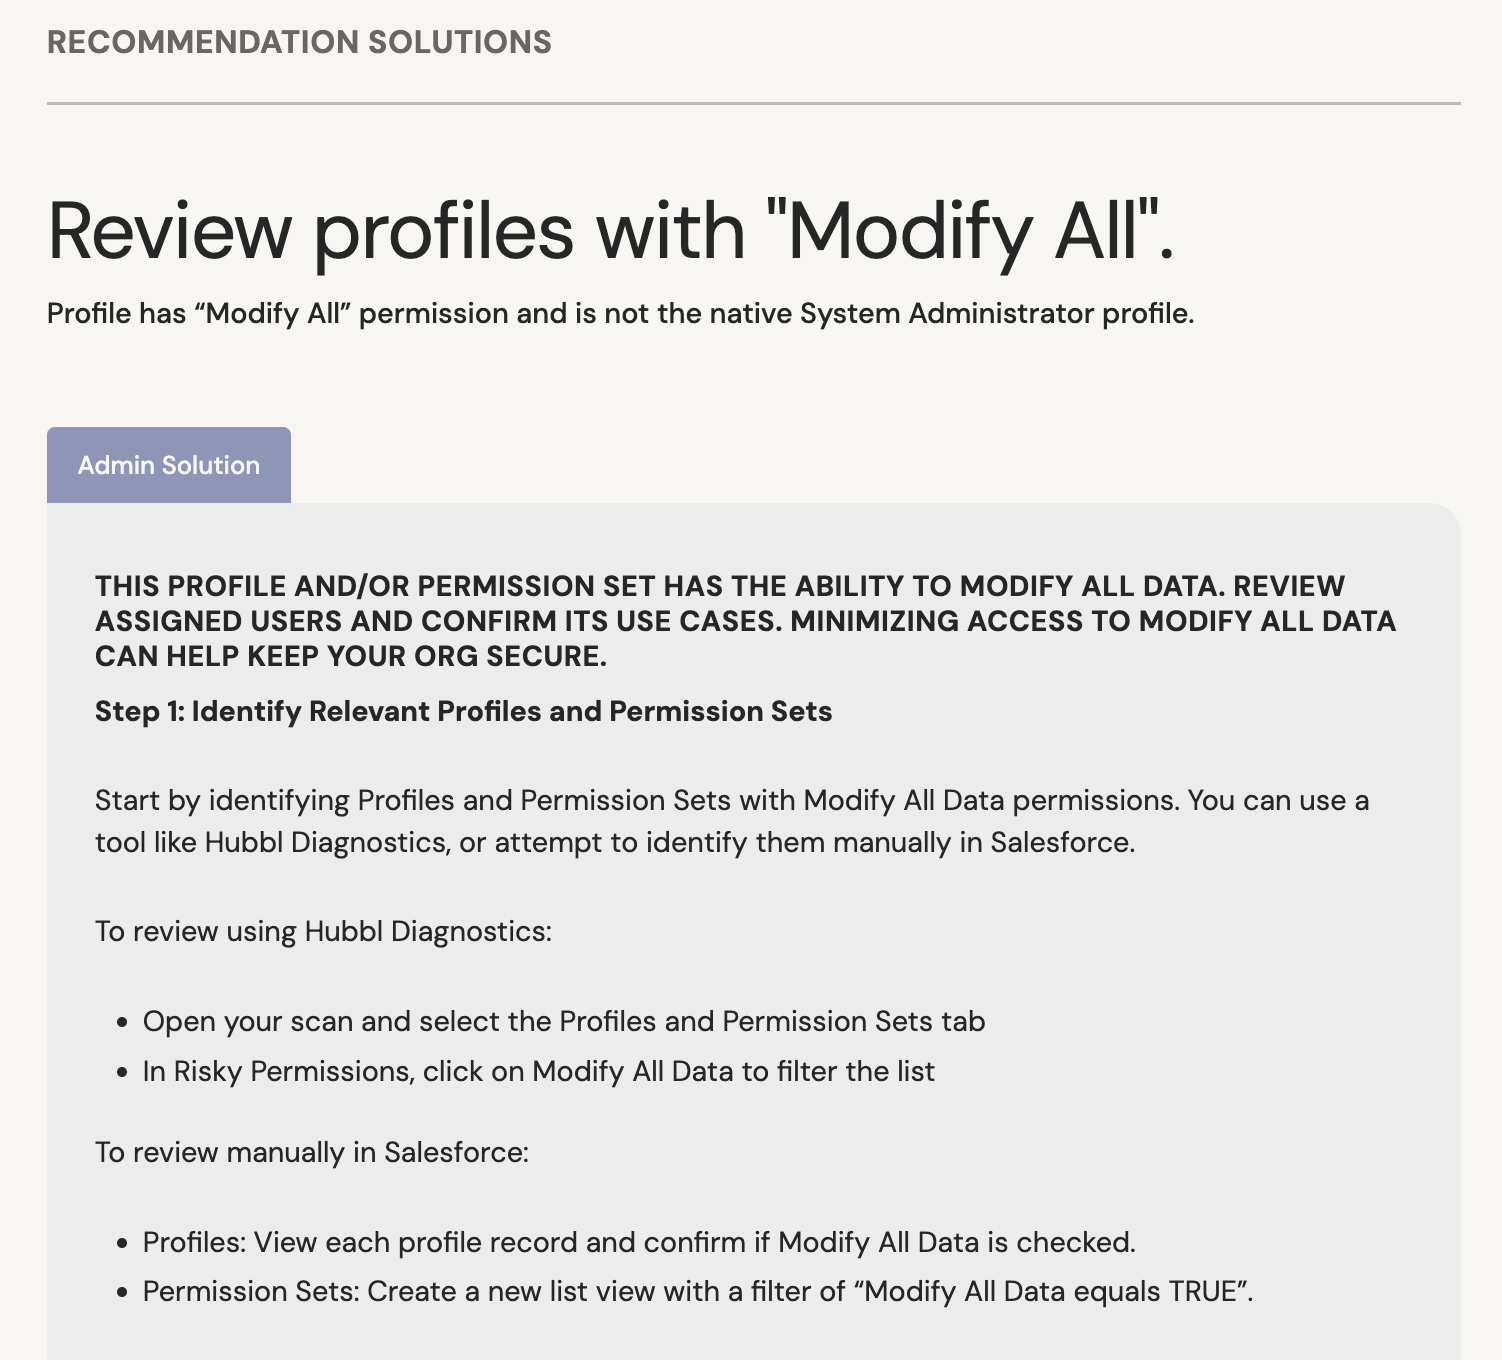
2. View solution: The Recommendation Details will appear, where you can learn the solution for each recommendation.
3. Select Admin Solution or Developer Solution: Review documentation via our Learning Hub and share with your Salesforce Admin or Developer.
The Trends view helps visualize your org’s recommendations over time. This enables you to more effectively track progress, implement recommendations, and communicate success with stakeholders. Choose between 30-days, 3-months, and 12-months to track: